Primates
The last group of animals described in the database are the primates. The group of primates is one of the orders out of the subclass Eutheria. The order of primates consists of different families, species and subspecies. Ten of them are described in the database. These are the human, Chimpanzee, Bonobo, Gorilla, Orangutan, Gibbon, Baboon, Rhesus, Vervet and Howler. The information in the database consists of the same items as with the Ursidae and the Felidae: the genome sequence, mitochondrial genome sequence, SNP, microsatellites and some literature about that animal. Table 3 in appendix 1 shows a summary of that what is known about the Primate families. The known genetic information is present in the database. The phylogenetic tree, based on the alignment of the whole mitochondrial genome sequence about the families of the primates, is shown in figure 12.
This phylogenetic tree contain the conclusion of Shosani et al. Almost all species in figure 13 are also included in figure 22. These species are orientated in the same way in both phylogenetic trees. This prove that this could be the right orientation of the species. Shi et al. places the Human (homo), the Chimpanzee (Pan) and the Gorilla (Gorilla) in another position in the tree than the phylogenetic tree than the trees in Figures 13, 20 and 22. The phylogenetic trees in Figures 13, 20 and 22 concluded the same about the Human (homo), the Chimpanzee (Pan) and the Gorilla (Gorilla). This proves that the conclusion of Shi et al. could be wrong and that the other trees have the right orientation of these species.
FIGURE 12 Phylogenetic tree based on the whole mitochondrial genome sequence of the human, Chimpanzee, Bonobo, Gorilla, Orangutan, Gibbon, Baboon, Rhesus, Vervet and Howler (families of the order primates). This tree is based on the alignment of these animals made in clustalX.
The mitochondrial genome sequence of one animal per family/species was used to make this phylogenetic tree. The mitochondrial genome sequence is known of all the families in the order of the primates. The phylogenetic tree includes all the described families. Figure 12 shows which animal species are most related based on the mitochondrial genome sequence. The second phylogenetic tree of the Primate order is based on the sequence of cytochrome b. For this phylogenetic tree ten humans, ten Chimpanzees, ten Bonobos, four Gorillas, four Orangutans, ten Gibbons, ten Baboons, seven Rhesus monkeys, ten Vervet monkeys and ten Howlers cytochrome b sequences were used. Figure 13 shows which species are most related based on the hypervariable cytochrome b sequence.
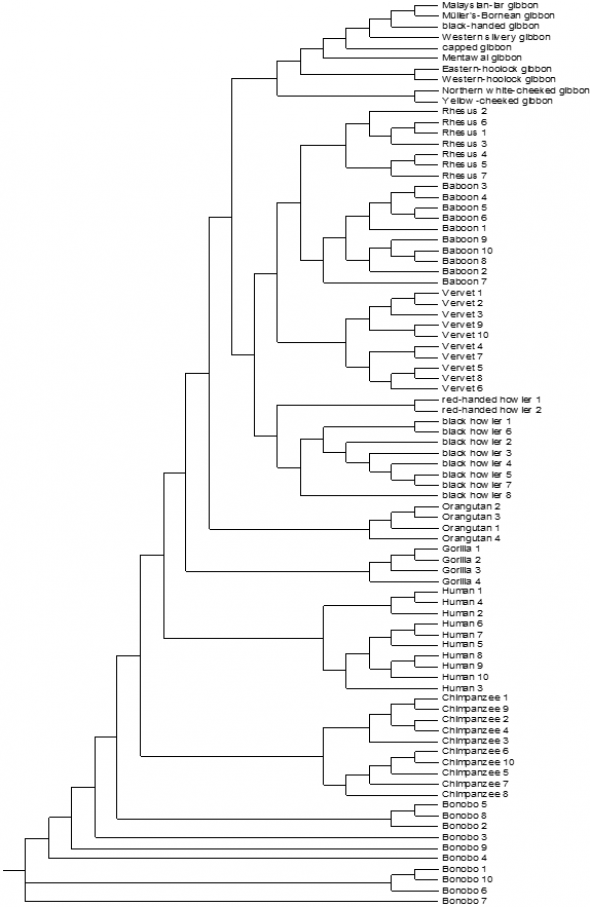
FIGURE 13 Phylogenetic tree based on the cytochrome b sequence of ten humans, ten Chimpanzees, ten Bonobos, four Gorillas, four Orangutans, ten Gibbons, ten Baboons, seven Rhesus monkeys, ten Vervet monkeys and ten Howlers (Out of the order of primates). This tree is based on the alignment of these animals made in clustalX.
In many species genetic studies have been performed where the genetic relationships have been estimated between animals within a species and animals over species. These analysis need variation detected by sequencing (whole genome, parts of chromosomes , specific genes or gene families, mt DNA). The comparison between animals or species can be displayed in different ways such as in phylogenetic trees. With more genetic/genomic information the phylogenetic tree gets more accurate and will be more reliable.
The two phylogenetic trees in figure 12 and 13 differ from each other (even as the two phylogenetic trees of the Ursidae (bears) and the Felidae). The phylogenetic tree based on the sequence of cytochrome b have more animals per species (figure 13). This phylogenetic tree is more reliable, because there are more animals per species involved. The phylogenetic conclusion of Perez et al. is shown in figure 20.
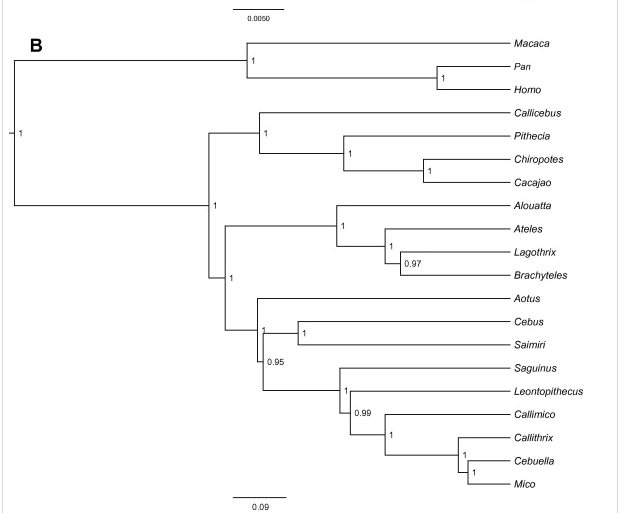
FIGURE 20 Phylogenetic trees based on the sub-dataset of 22 coding and non-coding sequences (Perelman et al., 2011). (B) BEAST concatenated tree. Node posterior probabilities and branch lengths are indicated on the graphs. (Perez, Klaczko, & Reis, Species tree estimation for a deep phylogenetic divergence in the New World, 2012)
They based the phylogenetic tree on the sub-dataset of 22 coding and non-coding sequences. This tree includes more different species than the tree shown in figure 13. The species that are the same in both phylogenetic trees are orientated on a different place in the tree. This can be caused by the amount of species or the different genetic information. The phylogenetic tree is made with a different program than the tree in figure 11. Perez et al. used the program jModelTest. This can also be a reason of the differences between the phylogenetic trees.
Figure 21 represents the conclusion of the phylogenetic tree made by Shi.
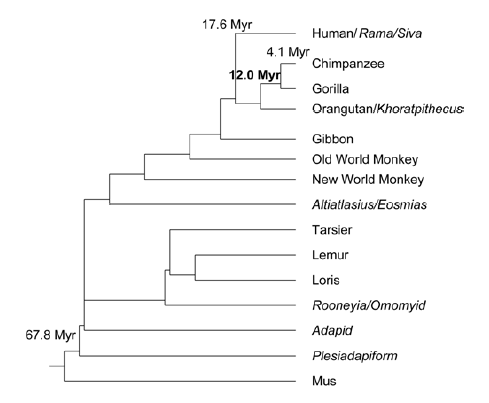
FIGURE 21 A phylogeny of primates. The relationships of selected major primates are shown, based on the results of the research of Shi. The shorter vertical distance between an MRCA node and one of the sister taxa indicates that a past member of that taxon was the ancestor of the MRCA (Shi, 2012).
The tree (Figure 21) contains only a few of the same species as in figure 20. Because of that it’s hard to compare. The tree has more species in commend with the tree in figure 13. Shi has some species grouped together in the ‘Old World monkey’s’ and in the ‘New world monkey’s’. The Gibbon, Baboon, Rhesus monkey and the Vervet monkey belong to the ‘New world monkey’s’ (Perez, Tejedor, Novo, & Aristide, 2013). The Howler belongs to the ‘Old world monkey’s’ (Barrett, 2000). In the phylogenetic tree of this research (figure 13) are also the ‘New world monkey’s’ properly grouped together. The other species that are the same in the tree made by Shi are in another way oriented in the phylogenetic tree. The reasons can be the same as by the tree made by Perez et al.
The phylogenetic tree in figure 22 contain similar species as in the other phylogenetic trees (figure 13, 20 and 21) and can be compared.
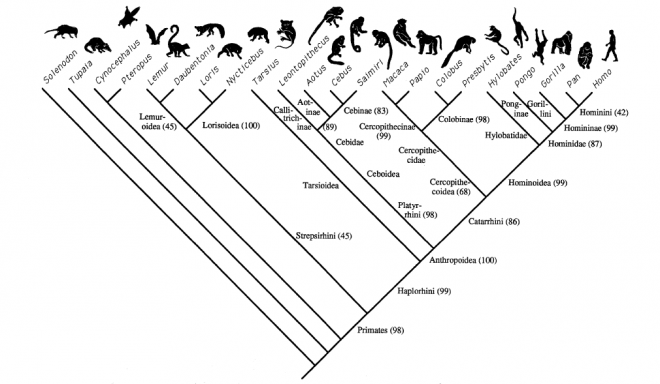
FIGURE 22 A cladogram obtained from PAUP analysis of 264 morphological characters on 18 primate taxa and four outgroups (PAUP settings were Heuristic search and tested in ACCTRAN and DELTRAN; characters unweight and unordered); bootstrap values for 1000 replicates are in parentheses. TL, length of tree; 604 steps (Shoshani, Groves, Simons, & Gunnell, 1996).