Molecular tools and phylogenetic trees of three populations: Bears, Cats, and Primates
Introduction
To perform genetic studies in big mammals it’s important to know which information is already known and available. The majority of the genetic studies on zoo-populations aim to unravel family structures and to decrease the inbreeding. There are different molecular options to perform these studies. such as whole genome sequence, mitochondrial genome sequence, single nucleotide polymorphism (SNP) and microsatellites. I want a database for all species but due to time limits I will focus on three groups of animals. This literature research includes the available genetic information about the Bears, Cats and Primates. All the genetic information of the animals is combined in this database. The database contains the genome sequence, mitochondrial genome sequence, SNPs, microsatellites and researches about the genetics of these animals. This database will benefit future research on the genetics of these animals. To give an example how the database can be used the mitochondrial genome sequence of the different species of bears, cats and primates are compared with each other. Based on this information a phylogenetic tree was made. But first a short description of some important terms to understand the database.
Molecular phylogeny
Phylogeny is an important tool to resolve biological questions about relationship within a population or even between different species. With the technology to sequence DNA it is possible to compare animals on basis of their DNA, and this comparison makes it possible to study genetic relationships such as phylogenetic analysis (Yang & Rannala, 2012). Genomic variation in the genome differences between individual animals within a species and animals over species arise (figure 1). The small differences, although sometimes high in numbers show us which species or individual animals are most related to each other. This can be done by looking how much differences (mutations) there are between species or individual animals (Bruin, 2015). The first step of making a phylogenetic tree is knowing which DNA is available and which one can be used. The various DNA are in different ways inherited. The different kind of DNA are autosomal DNA, mitochondrial DNA and Y-chromosomal DNA.
Autosomal DNA
Autosomal DNA is inherited from both parents in the same amount. Hereby is 50% of the DNA paternal inherited and 50% maternal inherited (figure 2) (Griffiths A. J., Wessler, Carroll, & Doebley, 2012).The whole autosomal DNA can be observed and compared. To obtain the sequence the whole genome is costly but will give all the variation present.
Mitochondrial DNA
A mitochondrion is an organelle that appears in every cell in relative high numbers, and is mainly responsible for the energy supply in the cell. The mitochondria’s contain circular hosting different genes (figure 3). Cytochrome b and the D-loop are parts of the mtDNA that are hypervariable (high rate of mutations). These hypervariable parts are a good tool to compare mtDNA of different animals (Lee, et al., 2013). The egg cells of the mother contains mitochondria, the sperm cells of the father does also contain mitochondria, but they are located in the tail of the sperm cell. The mitochondria in the tail of the sperm cell produce the energy to swim. After fertilisation the tail (with paternal mtDNA) falls of. This is the reason why the mtDNA is only inherited through the maternal line. Hence, the mitochondrial DNA solely inherited from the mother (Bruin, 2015). Mitochondrial DNA approximately 16K bp in size but mostly the hypervariable region (approximately 1500pb) is sequenced for the comparison between different individual animals.
Y-chromosomal DNA (Mammals)
Y-chromosome is one of sex chromosomes and only males have a Y-chromosome (XY), females have two X-chromosomes (XX) in mammals. In this way the Y-chromosomal DNA is only inherited from the father. Therefore only males can be compared with the Y-chromosomal DNA Due to the amount of repetitive DNA mostly parts of this chromosome is be used (Griffiths, Miller, & Suzuki, 2000).
Variation in DNA
The mutation in the DNA give rise to variation in DNA between different individual animals. To make a phylogenetic tree the differences in DNA need to be analysed. There are different ways to study variation, but mainly two types of variation is used 1. Single nucleotide polymorphism (SNPs) 2. microsatellites.
Single nucleotide polymorphism (SNPs)
A single nucleotide polymorphism (SNP) is a mutation in one nucleotide somewhere in the genome (figure 1). SNPs can appear everywhere on the genome, in exons, introns and in regulated regions. It is possible that a SNP within a gene can create differences in proteins and subsequently the phenotypes. SNPs can be used as markers to answer questions about the ‘gene flow’ in and between populations. The SNPs that are located the coding and non-coding regions can be used (Griffiths A. J., Wessler, Carroll, & Doebley, 2012). Almost all common SNPs have only two different alleles. This is called bi-allelic (Vignal, Milan, Sancristobal, & Eggen, 2002).
Microsatellites
Microsatellites are short sequences of two to six base pairs, these base pairs are then several times repeated. How much repetitions there are differs per allele. In figure 4 is are three microsatellites shown with the same base pairs, but with a different amount of repeats.There are many different microsatellite in the genome and all with a different amount of repetitions. The microsatellites consist of more base pairs than SNPs and because of this they are easier to detect (Griffiths A. J., Wessler, Carroll, & Doebley, 2012). Due to the different number of repetitions , microsatellite harbour multiple alleles .This is why mircosatellite markers are multi-allelic (Vignal, Milan, Sancristobal, & Eggen, 2002).
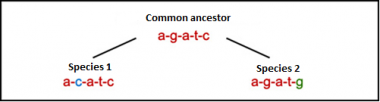
FIGURE 1 two small mutation (SNP) in the common ancestor give rise to two different species (species 1 and species 2).

FIGURE 2 The inheritance of autosomal DNA. Hereby is 50% of the DNA paternal inherited and 50% maternal inherited.
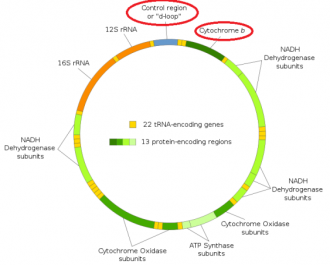
FIGURE 3 MtDNA with D-loop and cytochrome-b indicated with red circles
FIGURE 4 Three microsatellite markers with the same base pairs, but with different amount of repeats.